What does a heart attack look like on an ECG, its signs and a pathological Q wave
 What a heart attack looks like on an ECG, the cardiologist knows, and at the slightest suspicion of a disease, he will prescribe this examination procedure.
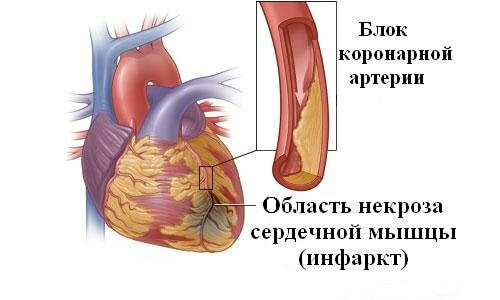
Myocardial infarction Is a terrible disease, the outcome of which depends on the accuracy of diagnosis and correct and timely treatment.
None of the diagnostic methods provide such accurate data on what a myocardial infarction looks like as ECG data.
In addition, this survey method is often the only possible one.
A cardiogram is a curved line that is recorded using a special device on narrow paper or electronic media. During normal operation of the heart muscle, the line is repeated in the same cycles.
Complex processes take place in the myocardium, issuing electrical impulses, which are recorded by the apparatus at the moment when they reach the surface of the skin.. A diagnostic method such as ECG, allows you to find out what myocardial infarction looks like and to prescribe the appropriate treatment in time.
A potential difference is formed on the electrodes, which the apparatus applies to the paper in the form of a line and its jumps. To record a cardiogram, special sensors are placed on the human body, which are installed on the arms and legs to receive standard and amplified impulses.
Another electrode is also used, which is installed in the heart area to receive 6 more impulses in the chest area. These graphic lines of a certain length show all the physiological processes taking place in different parts of the heart.
With good work of the heart without pathological changes, the ECG shows only five deviations, which doctors call the protrusions P, Q, R, S, T. They deviate from a straight line in polarity, height, and width. All teeth are responsible for different processes that occur in the myocardium.
It is possible to characterize a person's condition by the intervals between the protrusions P and Q, S and T, T and P, R and R, and also read the total value of QRST and QRS.

By these groups, you can decipher the sequence and time of activity of different parts of the heart muscle. With a healthy heart, its cycle always begins with the activity of the atria, which are shown on the cardiogram in the form of a protrusion P. Behind it, the line should be flat until it reaches the protrusion Q, that is, the interval between P and Q calculates the calmness of the heart muscle in terms of the time between the activity of the atria and ventricles (protrusion Q).
The QRST region is responsible for the propagation of activity throughout the ventricles. The protrusion R should be higher than all, as it corresponds to almost complete activity of the ventricles. The S protrusion is fixed when all ventricles are fully active. At zero phase, there is no potential difference, therefore, this phase on the cardiogram is indicated by a straight line. The T protrusion indicates the time it takes for the ions to return to their original position. And what a heart attack looks like on an ECG, let's talk a little below.
In the process of necrosis of a certain part of the myocardium, the electrical potential is greatly reduced and looks smaller than the rest of the intact tissue. This process on the cardiogram indicates the localization of the heart attack.
Pathological Q wave on the ECG and signs of myocardial infarction
 The pathological Q wave on the ECG indicates myocardial infarction, while its width is more than 0.04 seconds, and the depth is more than 25% of the amplitude of the R protrusion in the same lead. Based on the results of the examination, a diagnosis of myocardial infarction is made. ECG signs of this disease are already visible during the examination.
Changes show which area of the myocardium was affected as a result of a heart attack:
- Necrosis - is located in the center and appears on the cardiogram in the form of a change in the QRS region. In this area, the pathological Q wave on the ECG is most often manifested.
- Damage - located where tissue necrosis was formed, on the ECG this can be seen by the displacement of the S-T section.
- Ischemia - is located near the unchanged myocardium and is shown by the change in the values of the amplitude and polarity of the protrusion T reflecting the data.
According to the ECG data, you can also establish the depth of death of the muscle tissue of the heart.
For this, different types of heart attacks are described:
- transmural - the section Q-R-S changes to Q-S, that is, the protrusion R is absent at all;
- subpericardial - depression of the S-T section and altered readings of the T protrusion, and the Q-R-S section remains the same as during normal heart function;
- intramural - changes in the Q-R-S section, the rise of the S-T section, which merges with the protrusion T.
ECG signs of myocardial infarction are manifested in three stages:
- I - acute heart attack, lasts up to 3 days. The ECG records the rise of the S-T section, which merges with the T protrusion. This section begins to grow from the end of the R lip.
-
II - subacute heart attack, lasts up to
30-40 days. At this time, the ECG records the omission of the S-T section, which practically reaches the isoline. Also visible is the negative T. - III - cicatricial stage, which lasts a very long time. With postinfarction cardiosclerosis, the ECG will show abnormalities until the end of life. At this stage, the S-T section shows a straight line with a negative T.
 For some people, the dynamics on the cardiogram may not coincide with the changes in the heart. For example, the third stage is shown on paper before the scar itself is formed. And the second stage, on the contrary, is shown longer by
Therefore, the decoding of the ECG must be done on the basis of the clinical manifestations of the disease and additional laboratory tests.
Despite the fact that the easiest way to investigate myocardial infarction is using an ECG, it is often difficult to decipher the results of the examination.
It is difficult for obese patients to diagnose the disease, due to the fact that the location of their heart is changed.
Similar difficulties can be encountered when conducting an ECG in people suffering from diseases of the gastrointestinal tract, gallbladder and physiological structural features of the conducting system.
Partial use of site materials (no more than 30% of the content of the article) is allowed only with a hyperlink on www.med88.ru, full use of the article (more than 30% of the article content) is possible only with written permission edition.